By David Yamaguchi The North American Post
Before attending the Aug. 27 Garfield Centennial Celebration, my guess was that the event would be of interest to NAP readers. The reason is that while these pages do a reasonable job covering current news and World War II and its aftermath, the intervening period is only skimmed. It simply crosses our desks less often. The centennial presented an opportunity to make some amends.


On attending, I knew that older Japanese Americans commonly attended Garfield. Examples we have covered lately include Manzanar nurse Natsuko (Yamaguchi) Chin, Rose (Kobata) Harrell (mother of Bruce Harrell, mayor), and Tomio Moriguchi (NAP publisher). By contrast, the children of that Nisei generation tended to attend more southerly schools. Examples in these pages include Tom Ikeda of Densho and 37th District Representative Sharon Tomiko Santos (both Franklin H.S.), educator turned poet Larry Matsuda (Cleveland) and Terry Takeuchi of Terry’s Kitchen (Rainier Beach).

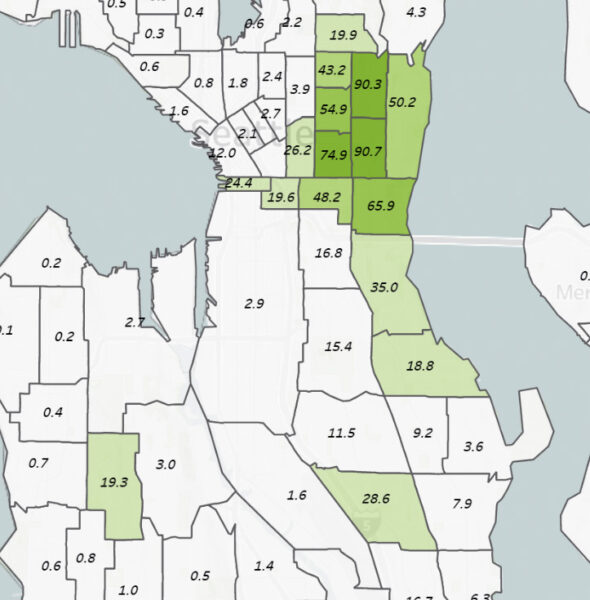
I knew that this pattern reflects redlining, discrimination in access to housing, before passage of the Fair Housing Act. But I had not known that where nonwhites could and could not live was so precisely demarcated until seeing the UW student-made maps of minority households by decade (above).

One dense population of Blacks in south King County today is in SeaTac (lower right), where intense noise from northbound jets racing their engines close to the ground during takeoffs every two minutes is stressful. To hear what residents contend with, spend a half hour there checking out Seike Japanese Garden, in Highline SeaTac Botanical Garden (bring earplugs). You may not be able to withstand more.
The historic maps of redlining and its aftermath above run through nearly every issue of this paper. I hope to explore them further in the near future.


All figures:
University of Washington Libraries, “Seattle/King County: Mapping Race 1940 – 2020 — Seattle Civil Rights and Labor History Project” (online). https://depts.washington.edu/civilr/segregation_maps.htm
The temporal spread of Asians through these same census tracts is similarly available and is a tale for another issue.


